Engine outputs: 5 Bozeman fixtures
These aren't rough estimates. Each fixture was run through the same engine that produces your actual study, industry-standard 2026 base costs, BLS PPI time index, county assessor land allocation, IRS Pub. 946 / Rev. Proc. 87-56 MACRS classification, 100% bonus depreciation per OBBBA.
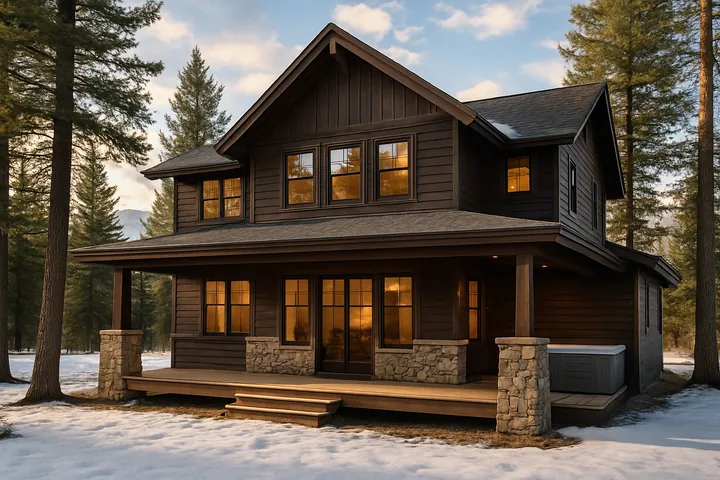
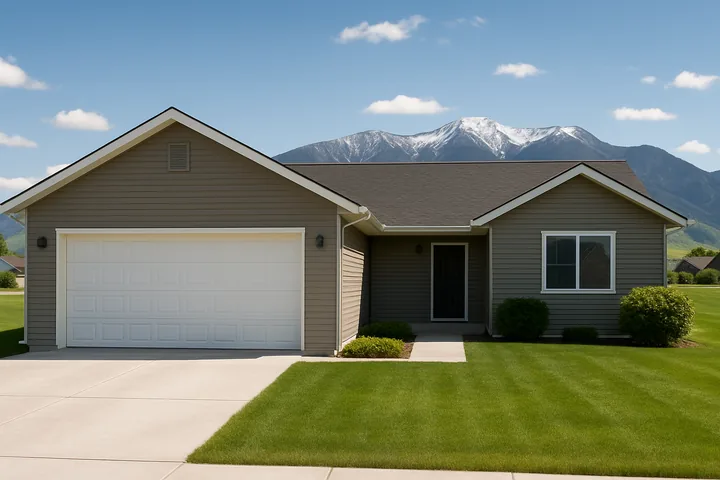
Downtown Bozeman SFR STR
$65,845
Year-1 federal savings @ 37% bracket, 100% bonus
| Purchase price | $985,000 |
| Depreciable basis | $804,154 |
| Land allocation | 18.4% |
| 5-year reclassified | $126,987 |
| 15-year reclassified | $48,620 |
| Total reclass | 22.1% |
MSU-Adjacent Student Rental
$35,024
Year-1 federal savings @ 37% bracket, 100% bonus
| Purchase price | $725,000 |
| Depreciable basis | $591,890 |
| Land allocation | 18.4% |
| 5-year reclassified | $57,393 |
| 15-year reclassified | $37,266 |
| Total reclass | 16.0% |
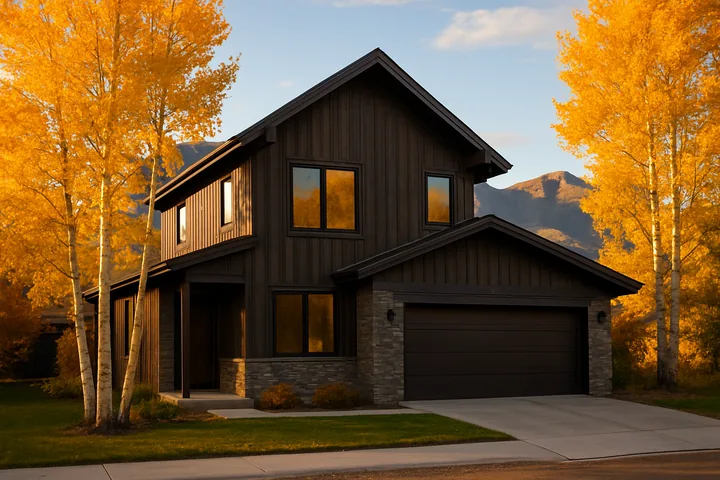
Bridger Foothills New-Build STR
$64,904
Year-1 federal savings @ 37% bracket, 100% bonus
| Purchase price | $925,000 |
| Depreciable basis | $755,170 |
| Land allocation | 18.4% |
| 5-year reclassified | $124,366 |
| 15-year reclassified | $48,324 |
| Total reclass | 23.2% |
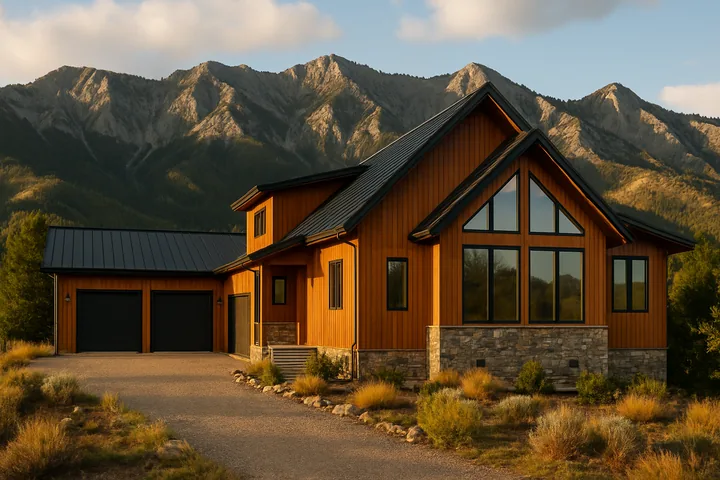
Gallatin Gateway Big Sky Feeder STR
$58,564
Year-1 federal savings @ 37% bracket, 100% bonus
| Purchase price | $825,000 |
| Depreciable basis | $673,530 |
| Land allocation | 18.4% |
| 5-year reclassified | $114,473 |
| 15-year reclassified | $41,221 |
| Total reclass | 23.5% |
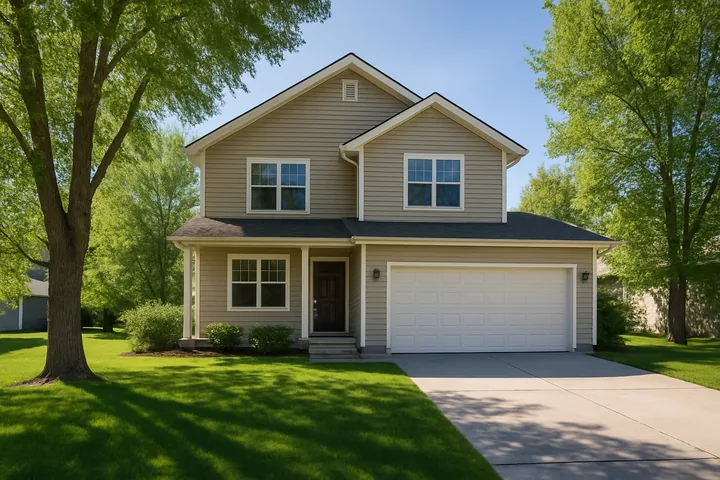
Belgrade Suburban LTR
$24,472
Year-1 federal savings @ 37% bracket, 100% bonus
| Purchase price | $525,000 |
| Depreciable basis | $430,500 |
| Land allocation | 18.0% |
| 5-year reclassified | $38,126 |
| 15-year reclassified | $28,014 |
| Total reclass | 15.4% |